
Electricity Markets
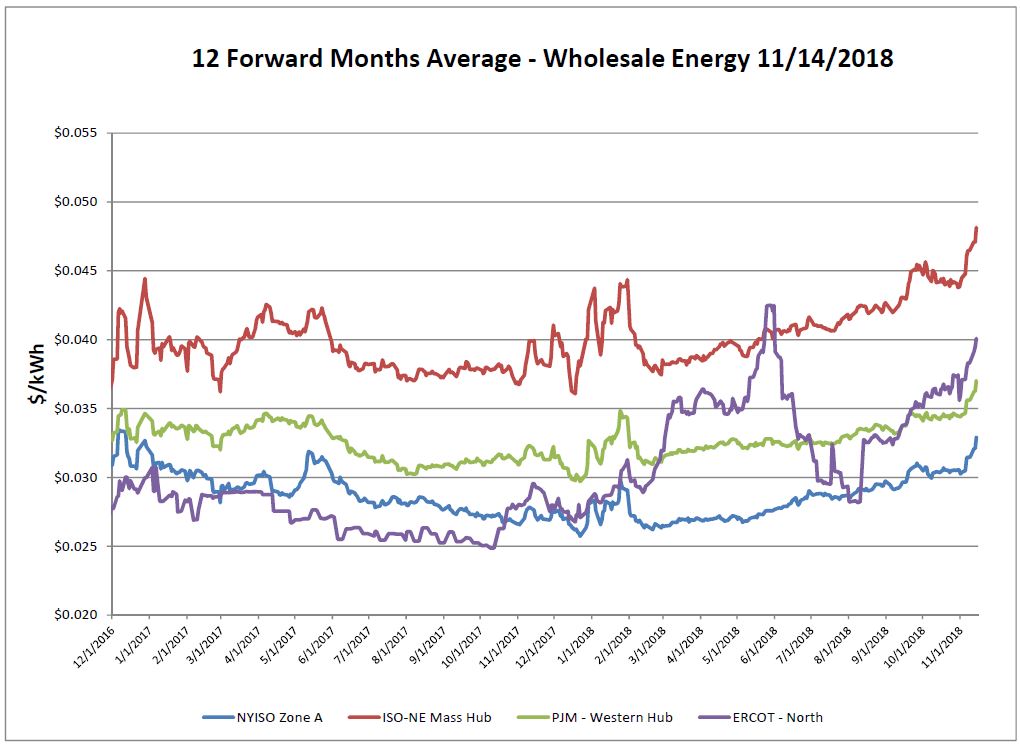
This graph depicts the average of the forward 12 months of electric pricing in each region. Over the report week there was another large increase in each ISO as a result of panic in the natural gas markets.
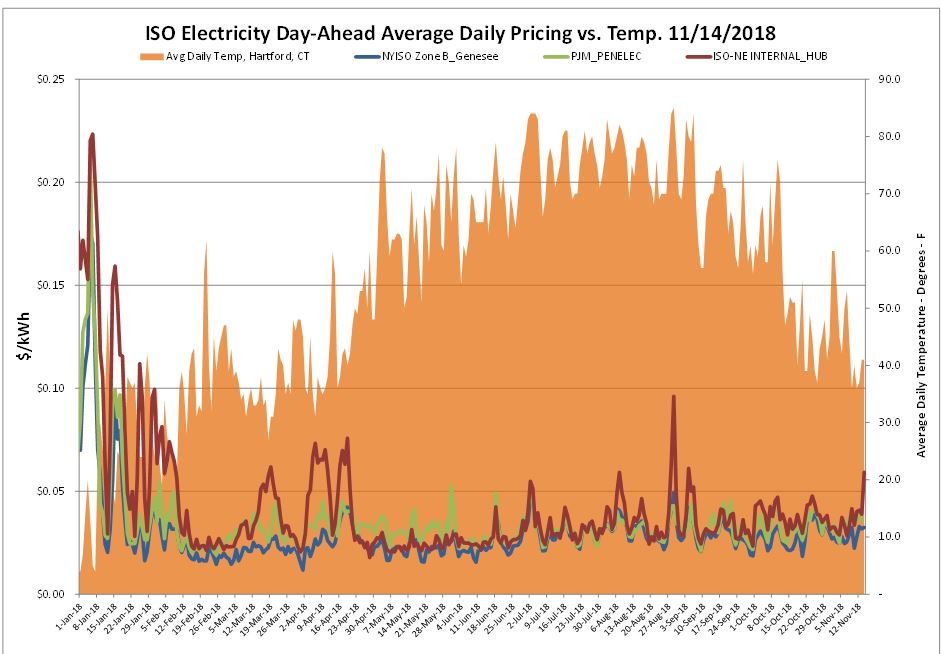
Day-ahead electric market was also up as a result of the colder than normal November temperatures and driven by forward gas prices.
Natural Gas Markets
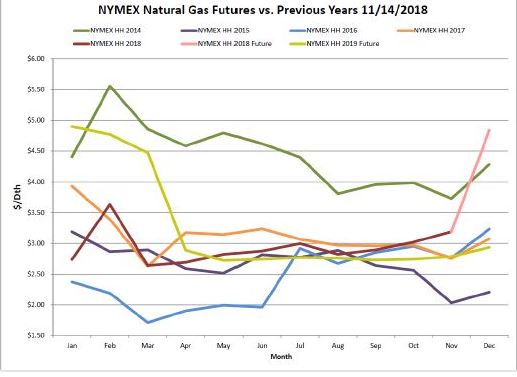
Over the report week futures for December ’18 had been extremely volatile, up as much as 20 percent in a panic for a weekly high of $4.837/Dth. This is the highest price for a prompt month contract since February 2014, which was an unseasonably cold winter with low inventory levels. The price of the 12-month strip (averaging December 2018 through November 2019) climbed 45 cents. Prices were supported by near-term weather outlooks, winter forecast uncertainty and no sign of storage recovery. Regardless of high production, demand has continued to exceed supply. Getting gas where it is needed is also a problem.
*Please note that not reflected in the figures of this report, after the storage report was released, the swing went almost just as much in the opposite direction. On Thursday the prompt month contract saw the greatest day-on-day loss since July 17, 2008, sliding nearly 80 cents.*
Volatility and uncertainty has remained consistent. There is still time in the next few weeks for things to materialize as December’18 has not closed yet. However, storage has no chance to recover and there is no unseasonably warm weather in the forecast.
Prices for next winter have remained quiet despite the near-term volatility. Next December ‘19 has actually gone down. If you are already locked in for this upcoming winter, this price spike can provide warning of how sudden and high prices can go. These types of situations highlight the risks of being on a variable/index rate.
Six-Month Natural Gas Futures
Futures as of 11/14/18 versus previous week:
| Dec-18 | $4.837 | +1.282 |
| Jan-19 | $4.898 | +1.329 |
| Feb-19 | $4.770 | +1.342 |
| Mar-19 | $4.472 | +1.364 |
| Apr-19 | $2.888 | +0.143 |
| May-19 | $2.722 | +0.022 |
Natural Gas Inventory
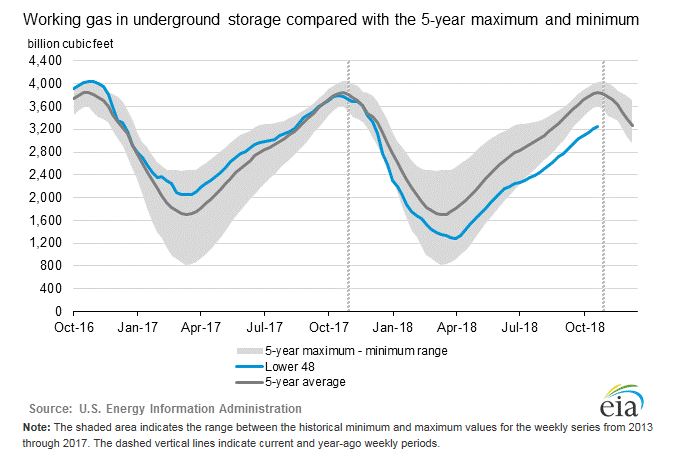
The EIA reported a net increase of 39 Bcf from the previous week. Keep in mind this injection reported for the week ending November 9th, prior to the below normal weather. Therefore, next week’s expectation for withdrawal could be looming around 100+ Bcf. Working gas in storage was 3,247 Bcf as of Friday, November 9, 2018.
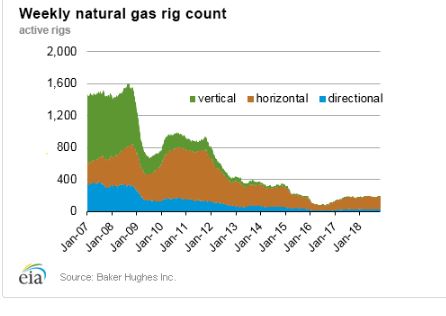
The Baker Hughes exploration gas rig count decreased by 1 rig week over week for a total of 194 rigs. This is 17 more rigs than were in operation at this time one year ago when there were 177 rigs.
Weather Update
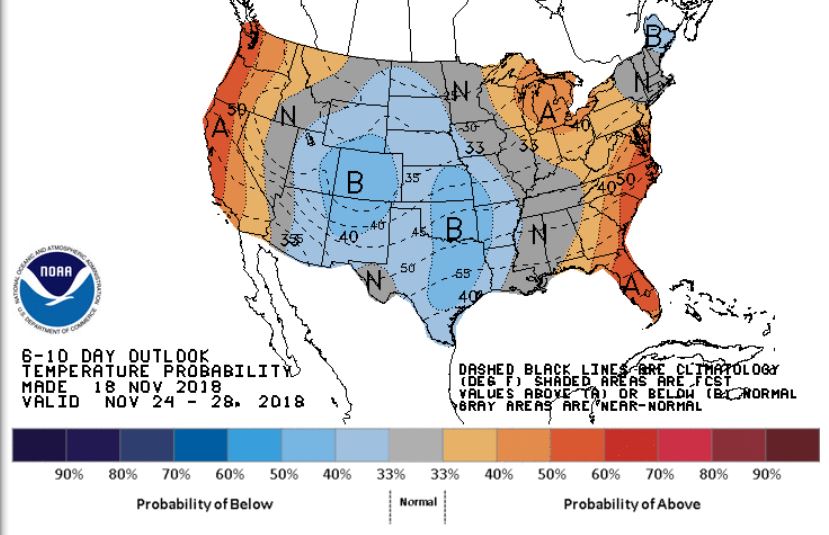
Weather forecasts for the end of November appear to be less extreme. The east and west coasts may see some slightly above normal temperatures, while the middle of the CONUS may experience weather that is a little cooler than normal.
National Weather Service Updates (NOAA)
Hurricane Watch- No Hurricane Activity
Click here to view the National Hurricane Center site.
Equatorial Pacific Outlook:
Click here to view La Nina and El Nino status.
Energy News & Resources
Think Oil Has Been Volatile Watch Natural Gas
Extreme volatility continues in NYMEX gas futures
NYMEX December down 79.90 cents to $4.038MMBtu
If you would like to receive the Energy Market Update to your inbox weekly, please click here to submit your name and email address.
Disclaimer: This information is provided for the use of our customers and potential customers. Power Management Company assumes no responsibility or liability for the accuracy or completeness of pricing or information in this document. Historical data was obtained from sources that we believe to be reliable, but we do not guarantee its accuracy or completeness. It is not intended to provide advice or recommendation. Views are subject to change without notice.